What stands out after 23 games?
Part of the reason they play 162 regular season games in Major League Baseball is because that’s a season long enough to keep small spurts from truly defining an entire body of work. That means that 23 games – what the Cincinnati Reds have played so far in 2025 – is hardly a blip on the radar, especially since they’ve only played a handful of the 29 other teams in the league so far.
Still, it’s a juncture where taking stock of where certain metrics rank can at least become a little eye-raising, and that’s what we’ll highlight today – areas that seem so far on an end of the realm that they’re either a) due for serious regression or b) beginning to look like a thing.
First up, let’s look at the Cincinnati batters, an offense that’s blown very, very hot and extremely cold at times already in this young season.
Take, for instance, the overall percentage of balls that qualify as ‘Hard Hit’ by Baseball Savant. You’ll find that the Reds, so far, have hit 37.3% of their balls in that category, and that’s the single lowest mark in the entire league. The small-sample caveat applies here, and there are other mitigating factors that may allow for a more promising number at season’s end. Austin Hays (54.2%) has barely played but is smashing the ball more often than even Elly De La Cruz (53.4%), while Tyler Stephenson (43.9% in 2024) hasn’t even played yet at all.
Concerning in a similar vein is their collective EV50, or the average exit velocity of the hardest-hit 50% of all balls put in play by the Reds this year. That number – 98.7 mph – also ranks last among the 30 teams. Their maximum exit velocity of 111.9 mph ranks as the 3rd lowest, and that makes a trio of indicators that suggest the Reds just might hit the ball hard less often than any other team out there (as currently constructed).
If you’re looking for an area where the Reds do something more than any other club, well, they sure seem to be pulling the ball more than all of their peers. Their 44.9% pull rate on all batted balls is the highest in the game, though that’s offset by their straight rate (33.7%, 2nd lowest) and opposite-field rate (21.5%, t-2nd lowest). Further mucking up this potential ‘best’ ranking is that their 26.0% rate of pulling grounders is the 2nd highest in the league, while their 18.8% rate of pulling balls in the air ranks just 12th – in other words, while they’re pulling the ball in total more than anyone, they’re also seemingly rolling over on a lot of grounders to account for a lot of that.
A squint at that group of numbers tells a story, sure. The Reds aren’t hitting the ball very hard, and they’re seemingly selling out for pull power more than most – potentially as a way to compensate for the otherwise lack of pop. We’re still early enough in the season to account for a lot of that noise with reasons that may be factual, and may well just be excuses – the injury bug keeping Hays, Matt McLain, and Tyler Stephenson on the shelf, the concentration of runs in a several blowouts (and numerous shutouts), etc.
On the other hand, it’s hard to see the following to batting profiles without wincing.
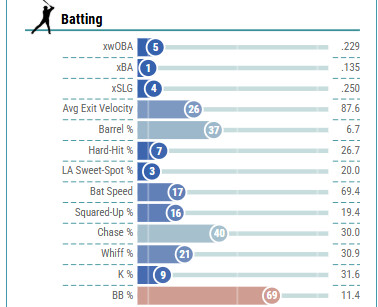
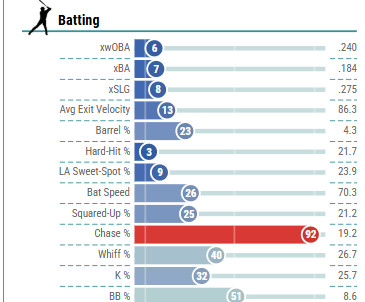
For those who don’t know, the numbers on those bar charts are their percentile rankings vs. the rest of the league. In other words, the top chart features a player whose xwOBA – or expected offensive production relative to the rest of the league – ranks in just the 5th percentile, with the bottom chart featuring a player whose xwOBA ranks in just the 6th percentile.
Blue numbers here, shall we say, are very much not good, yet the top chart here profiles Jeimer Candelario and the bottom that of Spencer Steer, two would-be stalwarts of this Reds offense in 2025 who don’t exactly have obvious answers to how to fix them. Candelario is an over-30 hitter who’s shown decline for years in a row now (and whose salary makes him almost completely immovable), while Steer’s persistent shoulder issue with no clear end-game diagnosis in sight makes how quickly he’ll be able to simply ‘snap out of this funk’ a serious worry as days pass.
It’s not a damning overall profile, and there’s certainly some promise within it. TJ Friedl appears to be bouncing back nicely from an injury riddled 2024, while Gavin Lux is doing the same another year removed from his torn ACL. Even Noelvi Marte – in an incredibly small sample – looks like perhaps last year truly might end up being just a lone lost year, and that there’s actually a bat with life left there somewhere.
It is still incredibly early! There’s a chance warm weather lets a lot more of this normalize! It would still, though, be nice to see a Reds club who plays in a ballpark where homers fly free hit the ball just ever so slightly harder and launch their own fair share into the GABP seats.
Stats courtesy of MLB.com’s Baseball Savant